A master chef toils in a kitchen creating a masterpiece which will inevitably
delight the most discerning palate. Across town, in an identical kitchen, a cook
using the exact same recipe and matching utensils creates a dish which is missing
a certain je nais se quoi.
Clientele frequenting the master chef's restaurant will notice a creativity
which is lacking elsewhere. There is something more than the exacting science of
the recipe and the precision of his tools which elevates the chef's culinary creations
beyond mere food. There is an art, bordering on magic.
Cycle Diagram
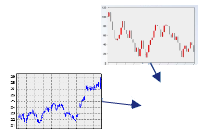
The cycle diagram to the left represents the process d-Orbital uses to
develop and maintain its programs along with the skills required at each step in the
process. Please click the components of the diagram for more detail.
Market Input
d-Orbital models are distinguished by their use of input from multiple market sectors to trade a single market. We understand that no market sector operates in a vacuum since each is influenced by the movements of other sectors or by the same factors as other sectors—whether fundamental or technical in nature.
2.
Market Data
Market data is the foundation upon which all market observations are made. Moreover, theories formulated from these observations must be validated using that same data. In developing market trading systems, it is imperative that one have clean data. Errors in data may lead to poor observations and will necessarily lead to poor statistical analysis. Similar to building a house, small errors at the foundation may lead to huge blemishes on the façade or even a catastrophic failure when complete.
3.
Observations
Employing a blend of both art and science is important in deciphering the markets. In doing so, one must be cognizant of the fact that market movements are random most of the time. Therefore, in order to gain an advantage over the randomness, one must identify non-random price behavior. This ability to translate the observable raw data into concepts is the art of the process. Making distinctive market observations is where creativity shines through.
Thousands of books have been written about the stock market claiming to contain this secret information. They are invariably written by people who have been successful in their activities. Sadly, there is no way of knowing whether their successes are the result of something real or produced by random chance. Observing, first-hand cause-and-effect relationships at work, is far preferable to reading technical books of someone else's digested views.
4.
Statistical Analysis
Let's start by taking a look at randomness by examining the flipping of a coin. This endeavor is a well-known example of a random 50/50 event. Flipping a coin and writing down the resulting string of heads or tails will produce a random string. A human, any human, looking at the results would be hard pressed to distinguish the results from any other string with or without patterns. Turning the result into something more visual, like a chart, may help, but these exercises usually result in the observer finding even more patterns in the random data.
A string of ten heads or tails may seem unusual but it is statistically quite possible and does happen. Even more possible is a string with a ratio of 20/10 or even 30/10. An unsuspecting observer would see all of these strings as trends. The mere fact that a human interprets these as trends, leads the observer to suspect that the data contain information about the probability of the next coin flip. But we know that they would be wrong since the results are derived from the known statistics of a coin flip. The probability remains 50/50 no matter what had come before.
Therefore, it is not enough just to recognize patterns. One must determine that the patterns seen are predictive and not just randomly generated. After all, our endeavor is to predict the future—the next flip of the coin. Since our human senses fail us in this pursuit, we must employ tools that extend our senses. We, at
d-Orbital, use statistics to validate our cause-and-effect observations.
Statistical Analysis
Let's start by taking a look at randomness by examining the flipping of a coin. This endeavor is a well-known example of a random 50/50 event. Flipping a coin and writing down the resulting string of heads or tails will produce a random string. A human, any human, looking at the results would be hard pressed to distinguish the results from any other string with or without patterns. Turning the result into something more visual, like a chart, may help, but these exercises usually result in the observer finding even more patterns in the random data.
A string of ten heads or tails may seem unusual but it is statistically quite possible and does happen. Even more possible is a string with a ratio of 20/10 or even 30/10. An unsuspecting observer would see all of these strings as trends. The mere fact that a human interprets these as trends, leads the observer to suspect that the data contain information about the probability of the next coin flip. But we know that they would be wrong since the results are derived from the known statistics of a coin flip. The probability remains 50/50 no matter what had come before.
Therefore, it is not enough just to recognize patterns. One must determine that the patterns seen are predictive and not just randomly generated. After all, our endeavor is to predict the future—the next flip of the coin. Since our human senses fail us in this pursuit, we must employ tools that extend our senses. We, at d-Orbital, use statistics to validate our cause-and-effect observations.
5.
Scientific Methodology
Statistics will not guarantee that our observations are predictive. They will only provide an indication that they are within a certain probability of being real. Performing statistical analysis is merely one aspect of the bigger picture. Employing a scientific methodology throughout the process is the main objective. Scientists are driven by the empirical nature of science:
Theory guides, experiment decides. The scientist's laws and theories must conform to reality and are subject to constant critical reexamination. (
Atomic and Molecular Structure, Walter J. Lehmann, John Wiley & Sons, Inc.)
Many observations will not pass the scrutiny of science. No matter how clever, unique or creative a theory is, it must still pass real-world examination through scientific experimentation to be valid. And being once valid does not preclude it from reexamination. Observations and theories must continually be exposed to data that they have never seen before. (see adaptive feedback)
Scientific Methodology
Statistics will not guarantee that our observations are predictive. They will only provide an indication that they are within a certain probability of being real. Performing statistical analysis is merely one aspect of the bigger picture. Employing a scientific methodology throughout the process is the main objective. Scientists are driven by the empirical nature of science: Theory guides, experiment decides. The scientist's laws and theories must conform to reality and are subject to constant critical reexamination. (Atomic and Molecular Structure, Walter J. Lehmann, John Wiley & Sons, Inc.)
Many observations will not pass the scrutiny of science. No matter how clever, unique or creative a theory is, it must still pass real-world examination through scientific experimentation to be valid. And being once valid does not preclude it from reexamination. Observations and theories must continually be exposed to data that they have never seen before. (see adaptive feedback)
6.
Signal
The output derived from the art and science of the process is a signal. It indicates one of three actions to be taken by the trader—either Long (1), Short (-1), or money market (0). It contains no indication of the quality or magnitude of the expected move. The rigor of the science merely implies that there is a statistical advantage to implementing the signal. In short, the signal is purely a market timing tool without money management.
Making a distinction between money management and market timing allows for greater understanding and tuning of a system. Timing involves the identification of non-random price behaviors, making sure that what is found is statistically valid. Timing is a 100% exposure endeavor.
Money management techniques on the other hand are used to manage risk. They have nothing to do with timing. Money management is the art of keeping the risk of ruin to a minimum while still maintaining the profit potential of the timing rules. It is applied only as an overlay to timing rules and limits market exposure by limiting position size.
7.
Trading
The signal indicates to the trader the action to be taken. The trader merely implements that signal by trading the chosen market vehicle.
While this may seem like a minor role, it is fraught with danger. The trader must maintain consistency and discipline against any conflicting emotional cues. A missed trade, intentional or not, will likely wreck emotional havoc on subsequent trades.
The trader must have confidence to maintain his loyalty to the signal even when things are not going well. This is doubly important when the builder of the system and the trader are one in the same. Knowing the rules that contribute to the generation of the signal may cloud the trader's judgment if he has a predisposition to a particular rule. On the other hand, an independent trader must blindly maintain confidence in what to him is essentially a black box.
In either case, the trader must fight his doubt. It is easy to come up with reasons to override the signal. What if the rules don't work anymore? What if the markets have changed? What if I know something's happening overnight? The trader's work is harder than it looks. And now take into account the added pressure of having to execute at crunch time!
8.
Results
Patience is a virtue of the successful investor. One must allow time for the results to manifest themselves. The higher one's expectations for returns are, the more patience is required. This is due to the fact that higher returns are generally concomitant with higher volatility.
Results for
d-Orbital Solutions are verified by an independent 3rd-party vender.
Click for results.
9.
Adaptive Feedback
This feedback loop assures that models adjust to changing market conditions. Market sectors generally maintain their character over long periods of time. For example, bonds can be distinguished from equities by merely glancing at a chart. However, given that humans are involved in the process, the specifics of those movements change over time. Markets change and models must adapt to maintain their advantage. It is imperative that the results be fed back into the process for continual reevaluation. (see scientific methodology)


 info@d-orbital.com